Shiba Inu Skyrockets 50% in Volume: Is a New Price Rally Underway?
1. Background Overview
Shiba Inu (SHIB), a flagship meme coin, has repeatedly surged since its launch, driven by community hype and ecosystem campaigns. Despite enduring multiple bull and bear markets, SHIB has remained among the top 20 crypto assets into 2025. News of its recent trading volume spike has brought significant market attention, with investors widely speculating whether this marks the start of a new price rally.
2. Drivers Behind the Trading Volume Surge
- On-chain data revival: Per CoinMarketCap, SHIB’s 24-hour trading volume jumped from $342 million to $519 million, up 51.58%.
- External catalysts: ETH broke above $3,000 again, resulting in an increase in ERC-20 token prices. As a top asset on Ethereum, SHIB saw substantial benefit.
- Community momentum: The SHIB community recently launched the #SHIBBULL challenge on X (formerly Twitter), leading to increased user engagement and reposts.
- Market FOMO (fear of missing out) effect: Rising volume triggered FOMO among investors, resulting in persistent inflows from those pursuing the upward price movement.
3. Price Fluctuations
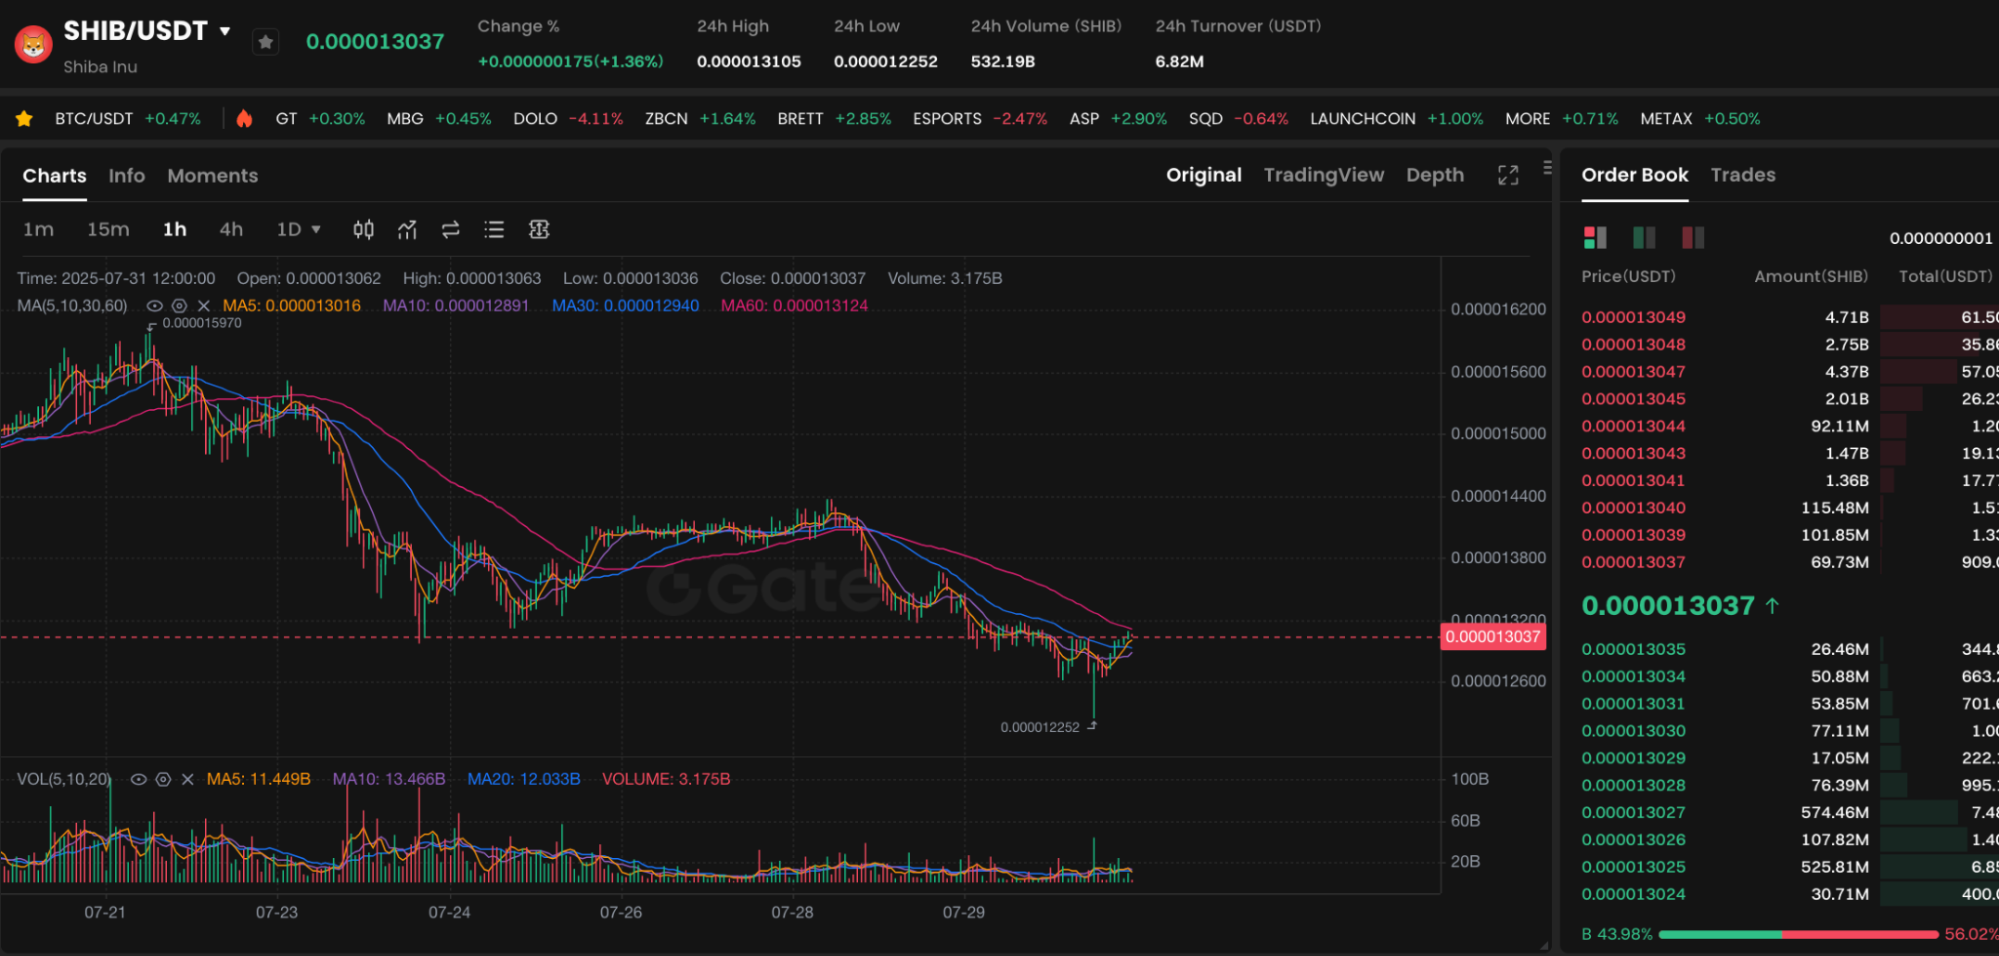
Chart: https://www.gate.com/trade/SHIB_USDT
- Lowest price: $0.00001368
- Highest price: $0.00001479
- Current price: about $0.00001441 (up 5.16%)
The price rebounded from around $0.00001360, decisively breaking through short-term resistance and temporarily piercing $0.00001480. This signals powerful buyer momentum. However, it has not yet sustained a breakout above the key $0.000015 level.
4. Technical Indicator Analysis
- Moving Averages (MA): The 7-day MA has crossed above the 30-day MA, forming a “golden cross”—a classic bullish signal.
- Bollinger Bands: Price is trading near the upper band, reflecting increased buying activity but also warning of possible near-term corrections.
- MACD: The bullish histogram continues to expand, with the MACD line rising sharply.
- RSI: Currently at roughly 68, just below the overbought threshold, signaling the need to monitor for potential short-term pullbacks.
5. Future Support and Resistance Levels
- Support: $0.00001380 (previous consolidation zone)
- Short-term resistance: $0.00001500 (psychological barrier)
- Medium-term resistance: $0.00001750 (around the yearly high)
If SHIB can hold at current levels and maintain elevated trading volume, it could potentially test even higher resistance zones.
6. Risks for Investors to Monitor
- Chasing highs risk: With the RSI hovering near the overbought area, entering positions without sufficient analysis could expose traders to pullback risk.
- Heightened volatility: Meme coins are inherently volatile and highly responsive to social media trends.
- Whale profit-taking: On-chain data indicates that some whale wallets have recently reduced their positions.
Related articles

Pi Coin Transaction Guide: How to Transfer to Gate.io

What is N2: An AI-Driven Layer 2 Solution

Grok AI, GrokCoin & Grok: the Hype and Reality

How to Sell Pi Coin: A Beginner's Guide

Crypto Trends in 2025
