- 话题1/3
2k 热度
521 热度
525 热度
39k 热度
29k 热度
- 置顶
- 🎉 Gate广场“星火计划”入驻KOL突破1000人!
💥 创作者生态迎来全面爆发期!
📈 上首页、拿奖励、赢影响力,你还在等什么?
💰 现金激励 ✔️
🚀 流量扶持 ✔️
👑 专属认证 ✔️
从0到1000,我们只用了短短数周,Gate广场正在成为Web3内容风暴眼⚡
你发布的不只是内容,而是下一个“爆款机会”!
🌟 加入星火计划,开启你的爆发之路!
👉 https://www.gate.com/announcements/article/45695
#GateSquare # #星火计划# #内容创作者新纪元 # #KOL集结令#
- 📢 #Gate广场征文活动第三期# 正式启动!
🎮 本期聚焦:Yooldo Games (ESPORTS)
✍️ 分享独特见解 + 参与互动推广,若同步参与 Gate 第 286 期 Launchpool、CandyDrop 或 Alpha 活动,即可获得任意奖励资格!
💡 内容创作 + 空投参与 = 双重加分,大奖候选人就是你!
💰总奖池:4,464 枚 $ESPORTS
🏆 一等奖(1名):964 枚
🥈 二等奖(5名):每人 400 枚
🥉 三等奖(10名):每人 150 枚
🚀 参与方式:
在 Gate广场发布不少于 300 字的原创文章
添加标签: #Gate广场征文活动第三期#
每篇文章需 ≥3 个互动(点赞 / 评论 / 转发)
发布参与 Launchpool / CandyDrop / Alpha 任一活动的截图,作为获奖资格凭证
同步转发至 X(推特)可增加获奖概率,标签:#GateSquare 👉 https://www.gate.com/questionnaire/6907
🎯 双倍奖励机会:参与第 286 期 Launchpool!
质押 BTC 或 ESPORTS,瓜分 803,571 枚 $ESPORTS,每小时发放
时间:7 月 21 日 20:00 – 7 月 25 日 20:00(UTC+8)
🧠 写作方向建议:
Yooldo
- 🎉Gate 2025 上半年社区盛典:内容达人评选投票火热进行中 🎉
🏆 谁将成为前十位 #Gate广场# 内容达人?
投票现已开启,选出你的心头好
🎁赢取 iPhone 16 Pro Max、限量周边等好礼!
📅投票截止:8 月 15 日 10:00(UTC+8)
立即投票: https://www.gate.com/activities/community-vote
活动详情: https://www.gate.com/announcements/article/45974
- 📢 #Gate广场征文活动第二期# 正式启动!
分享你对 $ERA 项目的独特观点,推广ERA上线活动, 700 $ERA 等你来赢!
💰 奖励:
一等奖(1名): 100枚 $ERA
二等奖(5名): 每人 60 枚 $ERA
三等奖(10名): 每人 30 枚 $ERA
👉 参与方式:
1.在 Gate广场发布你对 ERA 项目的独到见解贴文
2.在贴文中添加标签: #Gate广场征文活动第二期# ,贴文字数不低于300字
3.将你的文章或观点同步到X,加上标签:Gate Square 和 ERA
4.征文内容涵盖但不限于以下创作方向:
ERA 项目亮点:作为区块链基础设施公司,ERA 拥有哪些核心优势?
ERA 代币经济模型:如何保障代币的长期价值及生态可持续发展?
参与并推广 Gate x Caldera (ERA) 生态周活动。点击查看活动详情:https://www.gate.com/announcements/article/46169。
欢迎围绕上述主题,或从其他独特视角提出您的见解与建议。
⚠️ 活动要求:
原创内容,至少 300 字, 重复或抄袭内容将被淘汰。
不得使用 #Gate广场征文活动第二期# 和 #ERA# 以外的任何标签。
每篇文章必须获得 至少3个互动,否则无法获得奖励
鼓励图文并茂、深度分析,观点独到。
⏰ 活动时间:2025年7月20日 17
- 📢 ETH冲击4800?我有话说!快来“Gate广场”秀操作,0.1 ETH大奖等你拿!
牛市预言家,可能下一个就是你!想让你的观点成为广场热搜、赢下ETH大奖?现在就是机会!
💰️ 广场5位优质发帖用户+X浏览量前5发帖用户,瓜分0.1 ETH!
🎮 活动怎么玩,0门槛瓜分ETH!
1.话题不服来辩!
带 #ETH冲击4800# 和 #ETH# 在 广场 或 K线ETH下 围绕一下主题展开讨论:
-ETH是否有望突破4800?
-你看好ETH的原因是什么?
-你的ETH持仓策略是?
-ETH能否引领下一轮牛市?
2. X平台同步嗨
在X平台发帖讨论,记得带 #GateSquare# 和 #ETH冲击4800# 标签!
把你X返链接提交以下表单以瓜分大奖:https://www.gate.com/questionnaire/6896
✨发帖要求:
-内容须原创,字数不少于100字,且带活动指定标签
-配图、行情截图、分析看法加分,图文并茂更易精选
-禁止AI写手和灌水刷屏,一旦发现取消奖励资格
-观点鲜明、逻辑清晰,越有料越好!
关注ETH风向,创造观点价值,从广场发帖开始!下一个牛市“预言家”,可能就是你!🦾🏆
⏰ 活动时间:2025年7月18日 16:00 - 2025年7月28日 23:59(UTC+8)
【立即发帖】 展现你的真知灼见,赢取属于你的ETH大奖!
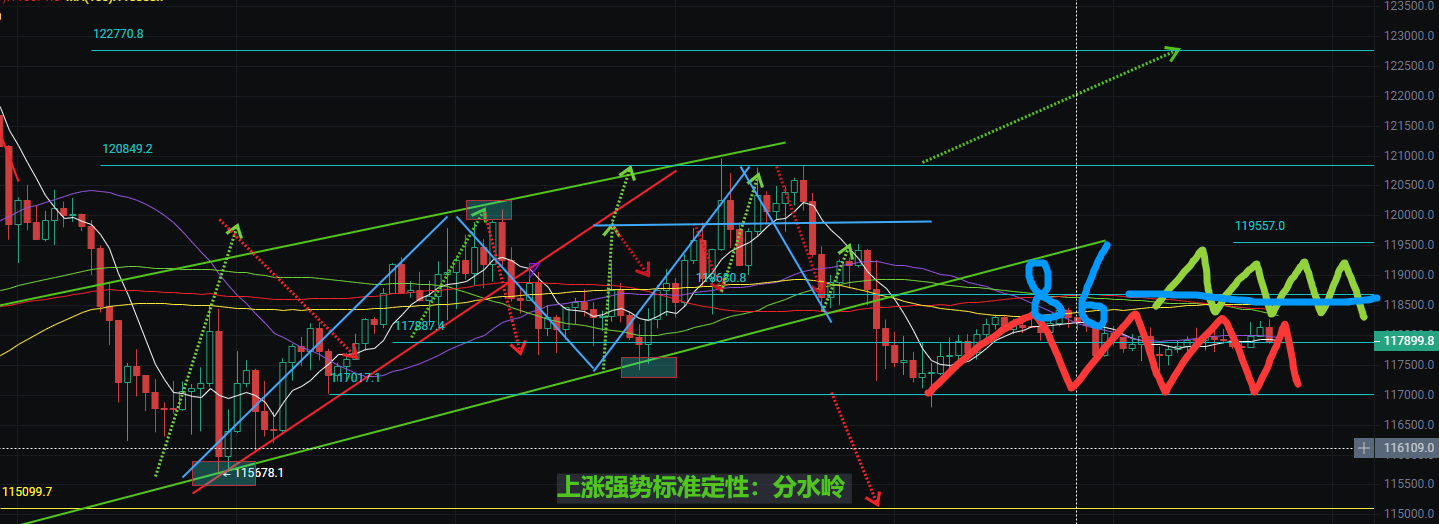
0720买预期,卖事实,比特币依旧处于剧烈震荡态势
0720比特币/以太坊行情播报❤️ ❤️
比特币价格在政策利好落地与技术回调修复的双重因素下,呈现剧烈震荡调整格局,短期需关注11.8万美元心理关口持续支撑力度。
一、比特币价格在7月18号重回突破12万美元关口,随后遭受多头获利了结与政策落地后的资金分流影响,价格快速回落至11.77万美元附近。当前日内在11.7万至11.9万美元区间震荡,受法案签署后市场情绪透支影响,未能站稳12万美元关口,若重新站稳119500美元阻力位亦或收盘价在该上方,短期目标上看121800(密集空单清算区);下方关键支撑位下移至11.6万美元(链上成本共振带)和11.5万美元(布林带中轨)以及11.4万美元(20日均线支撑)构成三重防线;上方11.95万至12.3万美元(前高)形成密集阻力带,唯恐突破需成交量放大至1000亿美元以上方可。中长期方面:日线图显示,比特币自减半后形成的上升通道持续完好,长期支撑线位于10.15万美元附近。
✅ ✅ 总结:比特币当前处于共振上涨阶段,技术面突破12万美元打开上行空间,但短期需警惕情绪透支与缩量上行的持续性。建议优先关注11.6-11.9万美元区间的突破情况以及密切留意资金流向,进行动态调整策略。
👉 👉 操作建议:一、日内短线:1.若价格回调至11.74-11.78万美元区间,可轻仓尝试多单,目标上看11.9-11.95万美元,止损设于11.65万美元。2.若价格反弹至11.9-11.95万美元,可考虑轻仓尝试做空,目标下看11.7-11.65万美元。二、震荡场景:(1-3天)若价格大体持续维持在,可采取高抛低吸方案:多头策略:考虑在11.6万-11.7万美元区间分批买入,止损11.4万美元,目标11.9万美元;空头策略:考虑在11.8-11.9万美元区间轻仓做空,止损12.1万美元,目标11.6万美元。
二、以太坊短期呈现突破后的震荡上行态势,ETH在政策利好推动下突破3450美元长期阻力位后,短期受制于3785(4小时图高点)。4小时图显示价格在3400-3700美元区间形成上升通道,下轨支撑稳固,若回调至3520美元(4小时MA100)可能形成买入机会。日成交量约1610万ETH(约600亿美元),较前一日显著放量,中长期需关注3800美元关键心理关口的突破力度,若突破可能开启向4000美元的快速上涨通道;反之,若意外性跌破通道下轨3400美元,则可能快速触发技术性回调至3200美元。当前以太坊价格4小时图显示价格突破上升楔形上边界3700美元,若回踩得到确认支撑,可能开启加速上涨。交易所储备持续下降至1700万枚的历史低点,供应紧张为价格提供支撑,以太坊期货未平仓合约激增至487亿美元的历史新高,借贷协议需求增加,总额回升至7.8亿美元,显示市场情绪极度乐观,但过热风险加剧。
✅ ✅ 总结:以太坊当前处于突破性上涨周期,技术面显示短期突破概率较高。密切关注3785美元阻力位的突破情况以及3400美元支撑的有效性,留意监管政策落地节奏,优先采取逢低做多,优先把握上涨主升浪利润空间机会。
👉 👉 操作建议:中期:一、若价格突破3785并回踩确认,可轻仓尝试多单,目标4000美元,止损则关注3520支撑位以及量能变化。二、若持续受制于3600美元,可能下探3420-3240美元强支撑区。
特别提示:本文仅供读者参考阅读,不作为投资依据!!!